
On paper, Q2 was the Asheville region housing market’s best quarter since Hurricane Helene devastated the area in 2024. Closed sales are up 8.8% from a year earlier. Sales prices modestly increased. Pending sales are up over 15% since this time earlier. However, those numbers fail to show the whole picture: reluctant buyers facing a market where high interest rates and affordability issues continue to be at the forefront of their decisions.
Home prices are increasing (with a caveat)
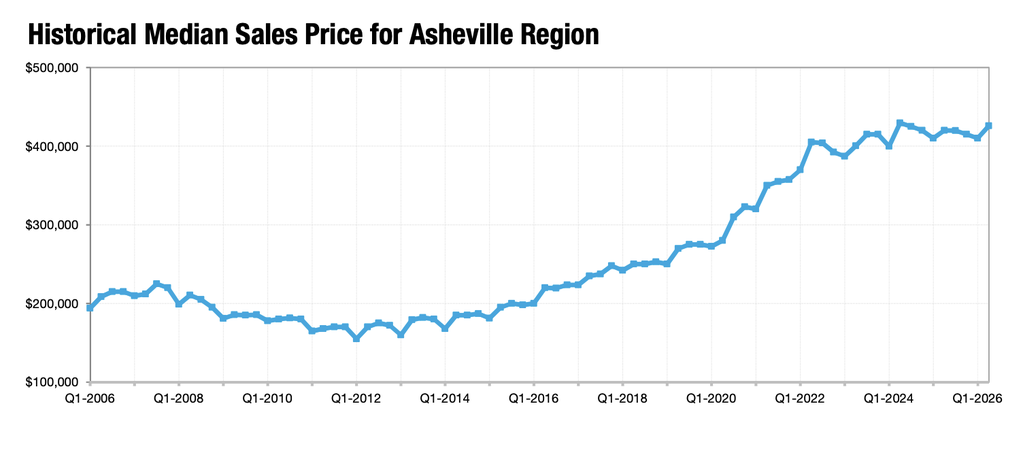
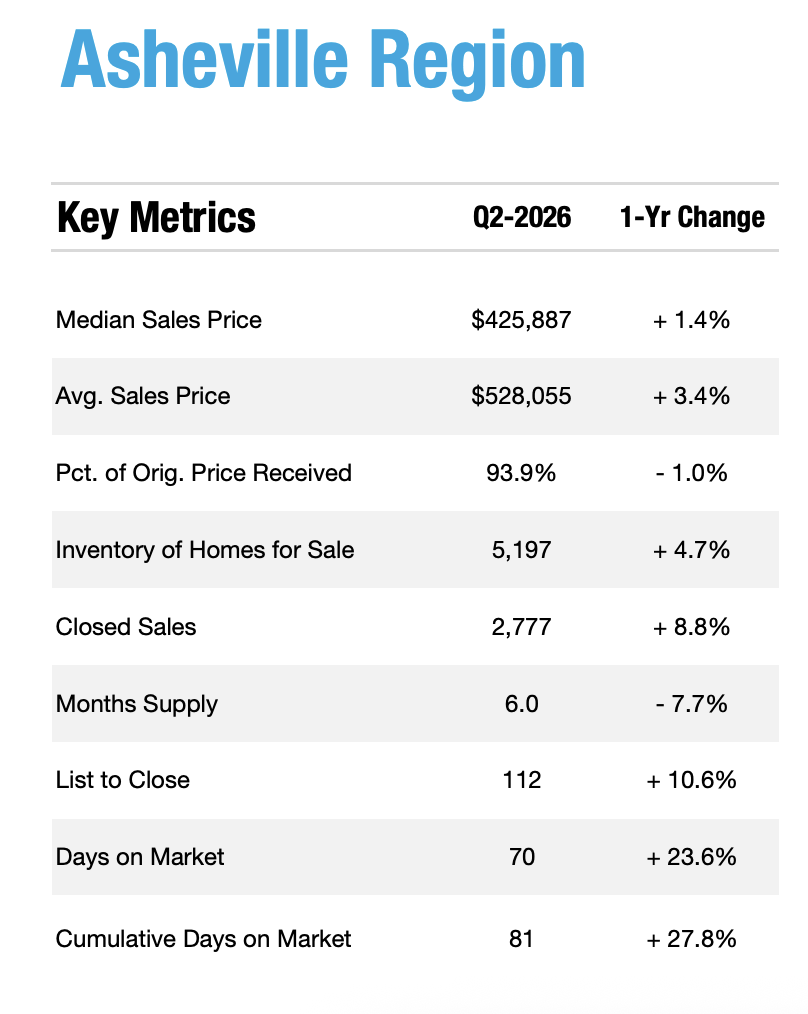
While high interest rates usually cause prices to decrease, both the average and median sales price saw a modest increase year-over-year. The median sales price increased 1.4% to $425,887 while the average sales price saw a 3.4% increase to $528,055. The region’s mountain lifestyle continues to attract buyers across all income levels and housing types.
A steady supply of inventory, with 5,197 housing units on the market compared to 4,963 at this time last year, was also a factor in increasing prices. Without a meaningful gain in inventory, prices can be expected to continue to appreciate, however mildly it may seem. Even nationwide, there are still about 18% fewer homes for sale than before the pandemic, Sorry folks – that means we aren’t predicting a housing crash any time soon.
On the other hand, sellers are receiving less than their original listing price. On average, homes are selling for 93.9% of list price, down 1.0% from a year ago. This simply reflects a market that has cooled from the exponential appreciation growth we saw earlier this decade.
Mortgage rates reach a 12-month high
The leading factor we see affecting buyers as we head into Q3 has been continuous high mortgage rates. Nationwide, mortgage rates climbed to their highest level in over a year, rising for the fifth week in a row. As of August 6, 2026, the 30-year fixed-rate mortgage averaged 6.69% according to Freddie Mac. With ongoing tensions in the Middle East leading to rising costs at home and no clear path on interest rate changes from the Fed, buyers are waiting until things look more promising nationwide before making a move.
Days on market hit a decade-high
Across the Asheville region, days on market increased 23.6% year-over-year to 70 days. List to Close, which includes the days spent under contract, increased 10.6% to 112 days. Buyers are negotiating longer due diligence periods while under contract and are likely to order additional inspections, obtain surveys, or delay appraisals until other conditions are met.
What opportunities do we see going into Q3?
With mortgage rates continuing to remain in the 6’s, the typical payment will be higher than it was a year ago, which is likely enough to keep more buyers on the sidelines while they calculate affordability.
Buyers and sellers are leaning into creative solutions to combat a reluctant market. Financing options like rate locks or buy downs are gaining momentum again. Sellers have started offering credits to offset closing costs for buyers, pre-paying homeowner’s association dues, or purchasing home warranties.
In this market, there are still opportunities for buyers and sellers. Buyers who can make the math work have more negotiating power right now. For sellers, while it may take longer to receive an offer, they can be rest assured that buyers in this market are more serious and committed to finding the right house. Working with an experienced real estate agent like Beth Zabriskie can help you navigate everything the market brings.
All data from Canopy MLS, Inc. The Asheville Region report includes Burke, Buncombe, Haywood, Henderson, Jackson, Madison, McDowell, Mitchell, Polk, Rutherford, Swain, Transylvania, Yancey counties. Comprised of single-family properties, townhomes and condominiums combined.
Definitions
New Listings
A count of the properties that have been newly listed on the market in a given month.
Homes for Sale
The number of properties available for sale in active status at the end of a given month. Also known as inventory.
Pending Sales
A count of the properties on which contracts have been accepted in a given month.
Closed Sales
A count of the actual sales that have closed in a given month.
List to Close
The average number of days it takes a property to go from listing to a closed sale.
Months Supply
The inventory of homes for sale at the end of a given month, divided by the average monthly Pending Sales from the last 12 months. Also known as absorption rate.
Sales Price
Calculations are based on sold data. Prices do not account for seller concessions. Median represents the point at which half of the homes that sold in a given month were priced higher and half were priced lower. Average is the mean sales price for all closed sales in a given month.
Percent of Original Price
Percentage found when dividing a listing's sales price by its original list price, then taking the average or median for all sold listings in a given month, not accounting for seller concessions.
Check out this article next